
The internet is an invisible yet essential part of modern life — but its environmental impact often goes unnoticed. As more organizations commit to climate action, one key question emerges: Is our digital presence helping the cause, or quietly adding to the problem?
To answer this question, we’re excited to release the #EcoWeb Report 2025, a benchmark of digital emissions of organizations in the climate space. Conducted by a team of 31 international volunteers through the ClimateAction.tech community, the #EcoWeb project analyzed the carbon footprint of 507 websites of organizations focused on sustainability. The results represent one of the first sector-wide benchmarks of digital emissions among climate action organizations — and serve as a call to action for anyone involved in building or managing digital tools and content online.
[Download the #EcoWeb Report 2025]
[Download the #EcoWeb Infographic 2025]
Why Website Emissions Matter?
The ICT sector accounts for up to 4% of global carbon emissions — more than the aviation industry — and its share is rising significantly. Every website, whether a simple homepage or a multimedia-rich platform, consumes energy with every visit. Each time someone visits a website, energy is consumed through data transfer, processing, and display. Therefore, cutting website emissions should no longer be viewed as a nice-to-have technical improvement, but as a meaningful step toward achieving digital sustainability goals.
How Did We Do It?
The #EcoWeb project used Ecograder, powered by The Green Web Foundation’s co2.js, and Google Lighthouse. With these tools CO₂ emissions, page weight, content breakdown, and hosting type were measured. By analyzing each site’s homepage with a consistent methodology, the report offers a reliable, actionable benchmark.
To get a bigger picture of the digital impact of the websites we analyzed, we looked beyond their carbon emissions. Our study examined several important factors, including page weight, a detailed breakdown of content types (such as images, media, scripts, and HTML/CSS), and the green hosting status of each provider. By combining these insights, we were able to identify key patterns, highlight effective strategies, and uncover best practices for reducing the environmental footprint of digital platforms.
What Did We Find?
The average homepage analyzed emits 1.87g of CO₂ per visit. While this might seem small, multiplied by thousands of visits a day, it adds up quickly. Emissions ranged from just 0.01g for the best-performing websites to over 21g for the least optimized. The figure below illustrates the strong disparity between the top 10% of best-performing websites and the bottom 10%, with the top 10% emitting up to 30 times less CO₂ per visit compared to the bottom 10% (Fig. 1). This wide range highlights the significant potential for improvement and the impact that thoughtful design and optimization can have on reducing a website’s carbon footprint.

To take it even further, we also examined the websites’ page weight, which is directly linked to the carbon emissions per visit. Larger page sizes require more data to be transferred, resulting in higher energy consumption. In our sample, page weights varied dramatically, ranging from just 0.11 MB to a staggering 58.88 MB. While most websites clustered toward the lower end, a small number of exceptionally heavy pages skewed the overall distribution.
Another interesting finding was that the 10% of websites with the lowest carbon emissions have an average page weight of 0.76 MB, while the 10% of websites with the highest carbon emissions have an average page weight 21.46 MB (Fig. 2). On average, pages weighed in at 5.7 MB—equivalent to streaming around 30 seconds of high-quality video—highlighting opportunities to optimize and reduce digital carbon footprints.

The breakdown of page weight reveals that images are by far the largest contributor, making up nearly half of the total (47%). Media files and scripts follow, accounting for 19% and 20% respectively. Given that the majority of page weight comes from images and media, even small improvements in their optimization could lead to substantial reductions. In comparison, HTML/CSS and other assets have a smaller impact—contributing 4% and 10% respectively— but still present additional opportunities for optimization (Fig. 3).

Extending our focus from page design to infrastructure, our analysis also included hosting. The hosting data across the 507 websites reveals an encouraging trend: 65% of them are hosted on green platforms powered by renewable energy. However, 35% still rely on non-green hosting, and for 1% of sites, hosting information was unavailable, indicating a small transparency gap (Fig. 4).
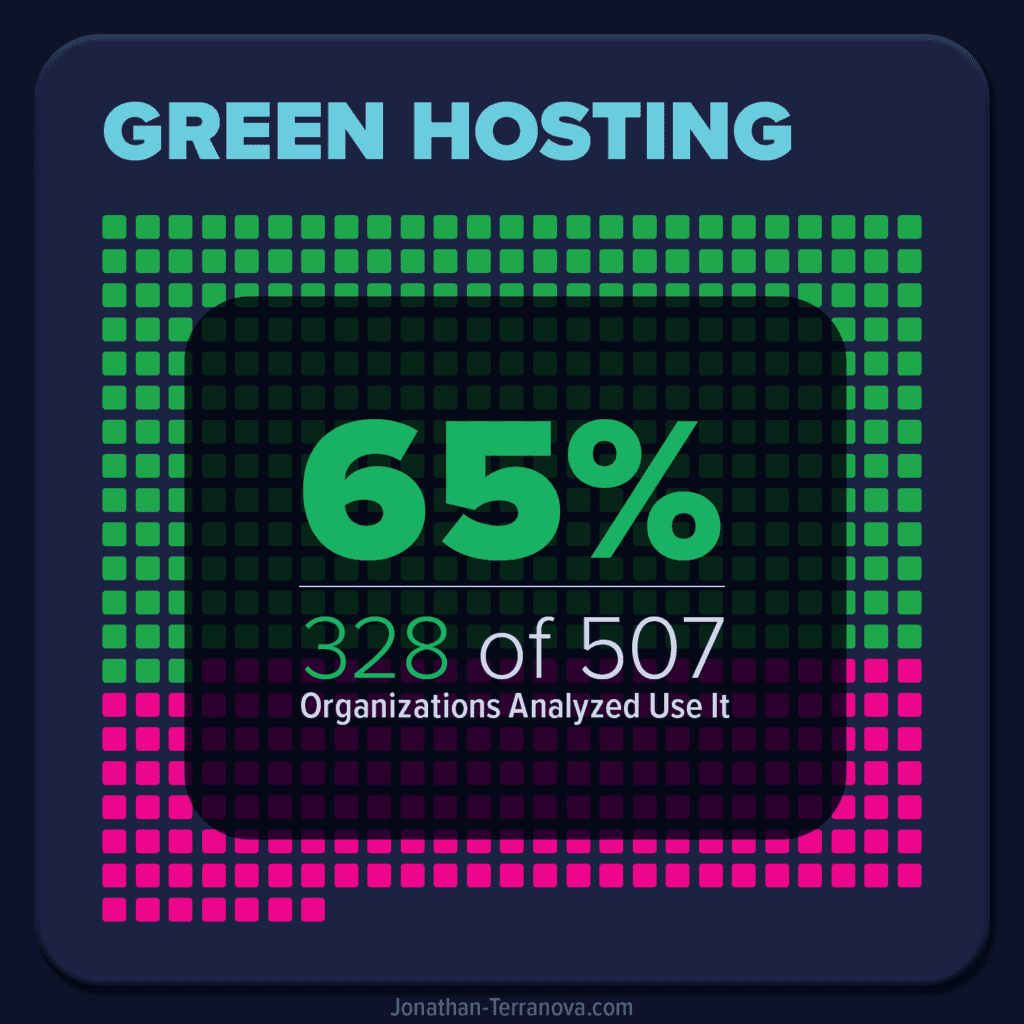
While website owners have limited control over the energy consumed by telecom networks or end users, they can influence the environmental impact of their site by choosing a green hosting provider. Switching to verified green hosting supports data centers that use cleaner, low-carbon energy sources, helping to drive the transition to a more sustainable internet for everyone.
In summary, our analysis reveals both challenges and clear opportunities for reducing the digital carbon footprint within the climate sector. The report identifies clear differences between top performing sites and those lagging behind, and shows how content, hosting, and other design choices all play a role in the digital carbon footprint of a website. Thoughtful design choices, optimizing media content, and selecting green hosting providers can collectively make a significant impact. By adopting these best practices, organizations can help build a more sustainable web that truly supports climate action.
What’s Next, and Why You Should Read the Report?
#EcoWeb doesn’t just reveal the numbers, it also points the way forward. The full report offers:
- Data to inspire change.
- Insights into why hosting and design choices matter.
- Guidance on how to track and reduce your own digital emissions.
- Practical steps to make your website greener.
Whether you manage a website, work in digital strategy, or just want to understand your online impact, the #EcoWeb Report 2025 is packed with insights and actions you can benefit from.
[Download the full #EcoWeb Report 2025] and discover how digital sustainability can drive real climate progress.
[Download the #EcoWeb Infographic 2025] and share it to help spread the word about sustainable digital practices.
Together, we can build a web that works for people, and the planet!